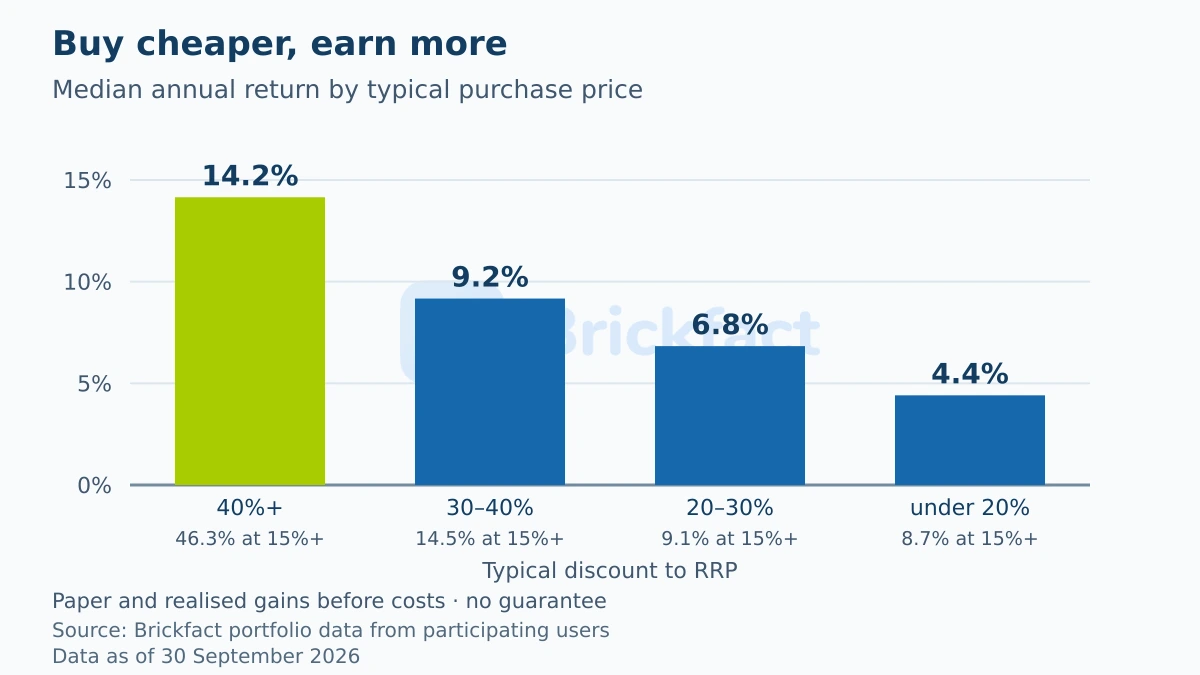
Lego collectors do make money on their sets, but less than many expect. We analysed the purchases and sales of 12,931 Brickfact users who together put €58.6 million into around 1.1 million sets. The typical collection returns 7.0% a year. A small group earns twice that: collectors who usually buy at least 40% below the recommended retail price (RRP) earn a median 14.2% a year, and only 1.3% of them are in the red.
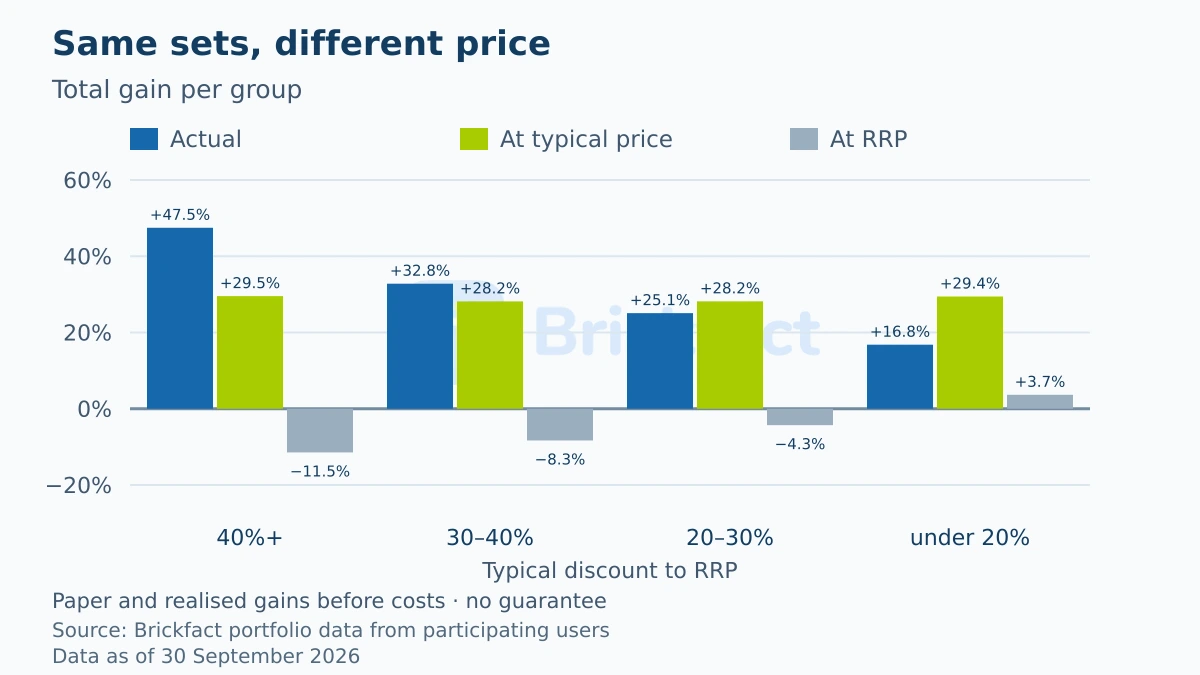
The difference comes from buying, not from picking. Value every group’s sets at the price collectors typically paid in the same year, and the groups end up almost level. The bargain hunters don’t choose better sets or better themes. They pay less.
This is the second edition of our Lego investment study. The first was published in German in 2024; what has changed since then is covered below.
Key findings
- 7.0% a year at the median. The middle half of collectors earn between 3.4% and 10.8%. So far, 12.1% have a negative return.
- The purchase price decides. Collectors who typically buy at least 40% below RRP earn 14.2% a year. With discounts of less than 20%, it’s 4.4%.
- Same sets, different price. Valued at the typical price, all four groups would show a similar total gain of +28.2% to +29.5%. Bought at full RRP, the bargain hunters’ own sets would stand at −11.5%.
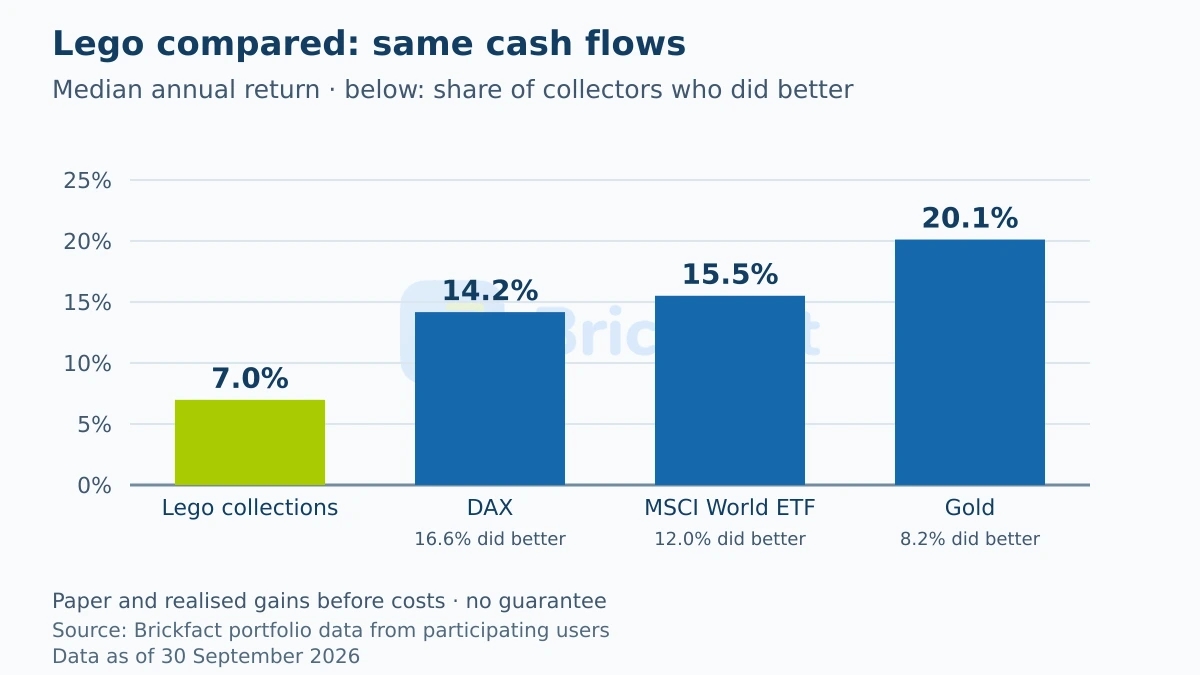
- An ETF would usually have done better. The same cash flows in an MSCI World ETF would have returned a median 15.5% a year. Only 12.0% of collectors did better. Among the bargain hunters, 44.5% did.
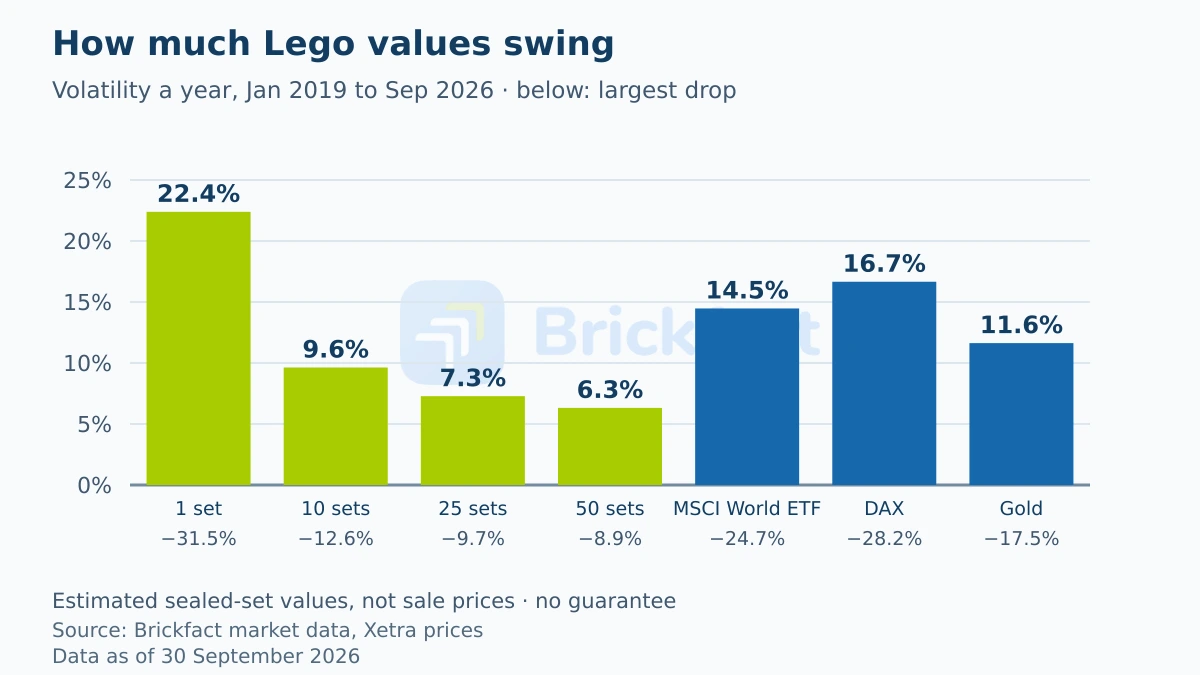
- Smaller swings, but only with many sets. Since 2019, the estimated value of a 25-set collection has fluctuated by 7.3% a year, an MSCI World ETF by 14.5%. A single set swings by 22.4%, more than the ETF.
- Sales return less than they seem to. Sold sets fetched a median +39.2% over the purchase price. After 13% for fees and shipping, +21.1% is left, and one sale in four (25.6%) ends in a loss.
- Discounts are normal. Since 2025, collectors have bought sets before retirement at a median 30.0% below RRP. November and December are the cheapest months.
What Lego collectors really earn
For each collector we calculate a money-weighted annual return, the internal rate of return. It uses the actual purchase prices and dates, the sale proceeds and dates, and the estimated value of the sets still held on 30 September 2026. That way, a set that sat on a shelf for five years counts differently from one bought three months ago.
| Measure | Value |
|---|---|
| Collectors analysed | 12,931 |
| Median annual return | 7.0% |
| Middle half | 3.4% to 10.8% |
| 10th to 90th percentile | −1.0% to 16.6% |
| Negative return | 12.1% |
| At least 15% a year | 12.3% |
| Arithmetic mean | 12.3% |
| Mean without extreme 5% | 7.5% |
| Total gain (median) | +25.8% |
| Amount invested (median) | €1,952 |
The mean of 12.3% is far above the median. A handful of very high values pull it up: over short holding periods, a quick gain scaled up to a full year produces very large numbers. Without the top and bottom 5%, the mean falls to 7.5%. That is why the median is our headline figure.
| Annual return | Collectors | Share |
|---|---|---|
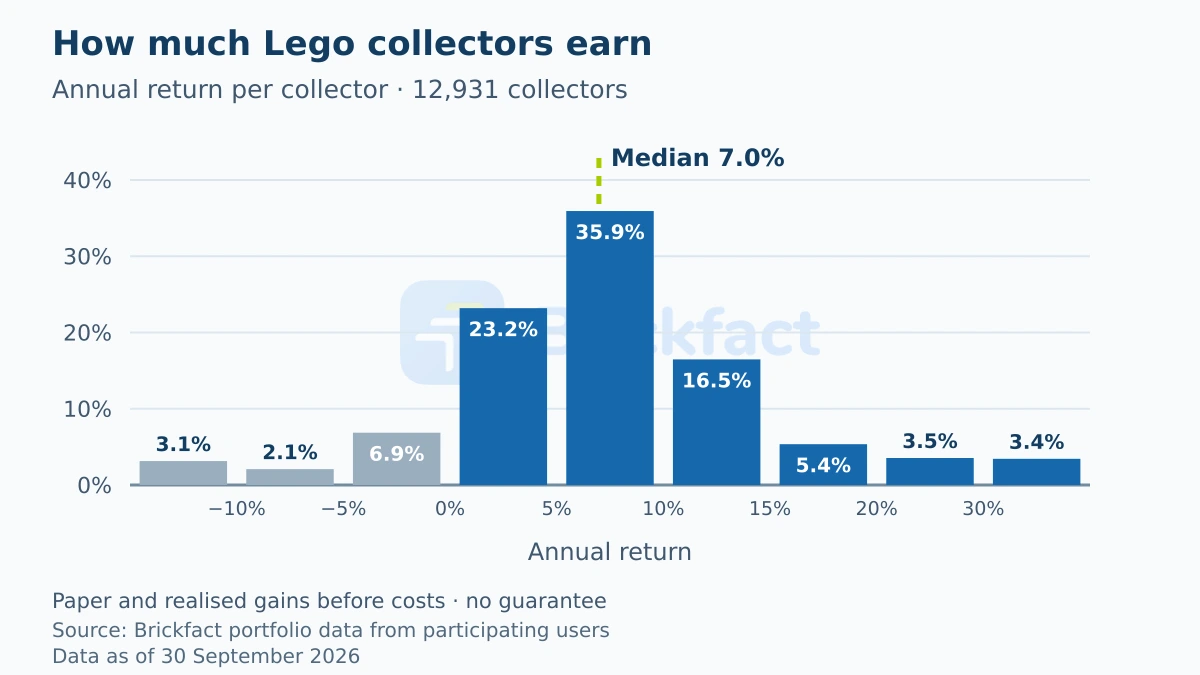
| below −10.0% | 406 | 3.1% |
| −10.0% to −5.0% | 269 | 2.1% |
| −5.0% to 0.0% | 887 | 6.9% |
| 0.0% to 5.0% | 2,999 | 23.2% |
| 5.0% to 10.0% | 4,646 | 35.9% |
| 10.0% to 15.0% | 2,130 | 16.5% |
| 15.0% to 20.0% | 692 | 5.4% |
| 20.0% to 30.0% | 458 | 3.5% |
| from 30.0% | 444 | 3.4% |
Results vary widely but are rarely dramatic. The largest group earns between 5% and 10% a year. 3.1% of collectors lose more than 10% a year.
It’s not what you buy, it’s what you pay
For each collector, we worked out what they typically pay relative to RRP: the median across all of their purchases. That gives four groups. The differences are clear and point one way: the bigger the usual discount, the higher the return.
| Typical purchase price | Collectors | Median a year | Middle half | 15%+ a year | Negative | Beat an MSCI World ETF |
|---|---|---|---|---|---|---|
| 40%+ below RRP | 715 | 14.2% | 9.9% to 23.2% | 46.3% | 1.3% | 44.5% |
| 30–40% below RRP | 3,126 | 9.2% | 6.7% to 12.3% | 14.5% | 2.7% | 13.9% |
| 20–30% below RRP | 4,035 | 6.8% | 4.0% to 9.8% | 9.1% | 8.0% | 8.9% |
| less than 20% below RRP | 5,046 | 4.4% | 0.5% to 8.3% | 8.7% | 22.7% | 8.5% |
In the group buying at least 40% below RRP, 46.3% of collectors earn 15% a year or more. Among those who usually pay less than 20% below RRP, 22.7% are in the red. The gap between these two groups is bigger than any difference we found between themes, collection sizes or the year collectors started.
Do bargain hunters buy different sets?
An obvious explanation would be that collectors with big discounts simply buy different things: small sets, retired sets or one particular theme. We checked. The differences are small.
| Typical purchase price | Invested (median) | Technic | Star Wars | Icons | Sets under €20 RRP | Bought after retirement | Holding period (years) | Share sold | Recorded at purchase |
|---|---|---|---|---|---|---|---|---|---|
| 40%+ below RRP | €1,118 | 13.6% | 24.6% | 11.8% | 6.4% | 26.0% | 3.4 | 10.4% | 98.3% |
| 30–40% below RRP | €2,146 | 7.8% | 26.9% | 14.2% | 6.6% | 21.6% | 3.2 | 11.4% | 93.4% |
| 20–30% below RRP | €2,002 | 6.5% | 28.7% | 16.0% | 6.4% | 24.8% | 3.7 | 6.7% | 91.4% |
| less than 20% below RRP | €1,936 | 6.3% | 27.0% | 17.2% | 11.7% | 32.0% | 3.9 | 2.6% | 91.7% |
The groups look alike in their themes, their share of small sets, their purchases after retirement and how long they hold. In every group, the median first recorded purchase was in 2022. Almost all of the bargain hunters’ purchases were logged in Brickfact at the time, not added years later. There are two differences: bargain hunters hold more Technic, a theme that is often heavily discounted, and their collections are smaller.
The same sets at the typical price
The decisive test: we value each collector’s sets as if they had paid what Brickfact collectors paid, at the median, for the same set in the same year. What remains is only the choice of sets.
| Typical purchase price | Actual total gain | Same sets at the typical price | Same sets at RRP |
|---|---|---|---|
| 40%+ below RRP | +47.5% | +29.5% | −11.5% |
| 30–40% below RRP | +32.8% | +28.2% | −8.3% |
| 20–30% below RRP | +25.1% | +28.2% | −4.3% |
| less than 20% below RRP | +16.8% | +29.4% | +3.7% |
At the typical price, all four groups land between +28.2% and +29.5%. The collectors with the biggest discounts did not pick better sets. Their lead, +47.5% instead of +29.5%, comes from buying cheaper. The last column shows what happens when the same sets are bought at full RRP: the gain shrinks to between −11.5% and +3.7%.
The same pattern shows up when you look at individual purchases instead of whole collections:
| Purchase price vs RRP | Purchases | Collectors | Median value gain | At a loss | Same sets at the typical price |
|---|---|---|---|---|---|
| 40–70% below RRP | 138,595 | 9,717 | +48.3% | 4.2% | +25.0% |
| 30–40% below RRP | 135,596 | 10,774 | +26.3% | 14.1% | +21.6% |
| 20–30% below RRP | 113,851 | 11,149 | +19.5% | 27.1% | +22.5% |
| 10–20% below RRP | 62,674 | 9,996 | +15.3% | 31.8% | +22.7% |
| 0–10% below RRP | 31,582 | 7,731 | +8.4% | 37.4% | +20.8% |
| above RRP | 152,097 | 11,040 | +0.8% | 46.6% | +20.3% |
Purchases made 40 to 70% below RRP gained a median +48.3% in value, and only 4.2% are at a loss. Purchases above RRP gained +0.8%, and almost half of them (46.6%) are at a loss. The last column shows again that the sets themselves were similarly good at every price level.
One caveat remains. This is an observation, not an experiment: people who consistently buy at big discounts may also behave differently in other ways. The profile and same-set comparisons, however, argue strongly against the obvious alternative explanations.
Lego, ETF, gold or DAX?
A fair comparison with other investments needs the same cash flows at the same time. So for each collector we calculated what would have happened if they had put every euro into an MSCI World ETF, gold or the DAX on the day they bought a set, and taken out the same amount whenever they sold one.
| Investment | Median a year with the same cash flows | Collectors who did better |
|---|---|---|
| Lego collections (actual) | 7.0% | – |
| MSCI World ETF | 15.5% | 12.0% |
| DAX | 14.2% | 16.6% |
| Gold (Xetra-Gold) | 20.1% | 8.2% |
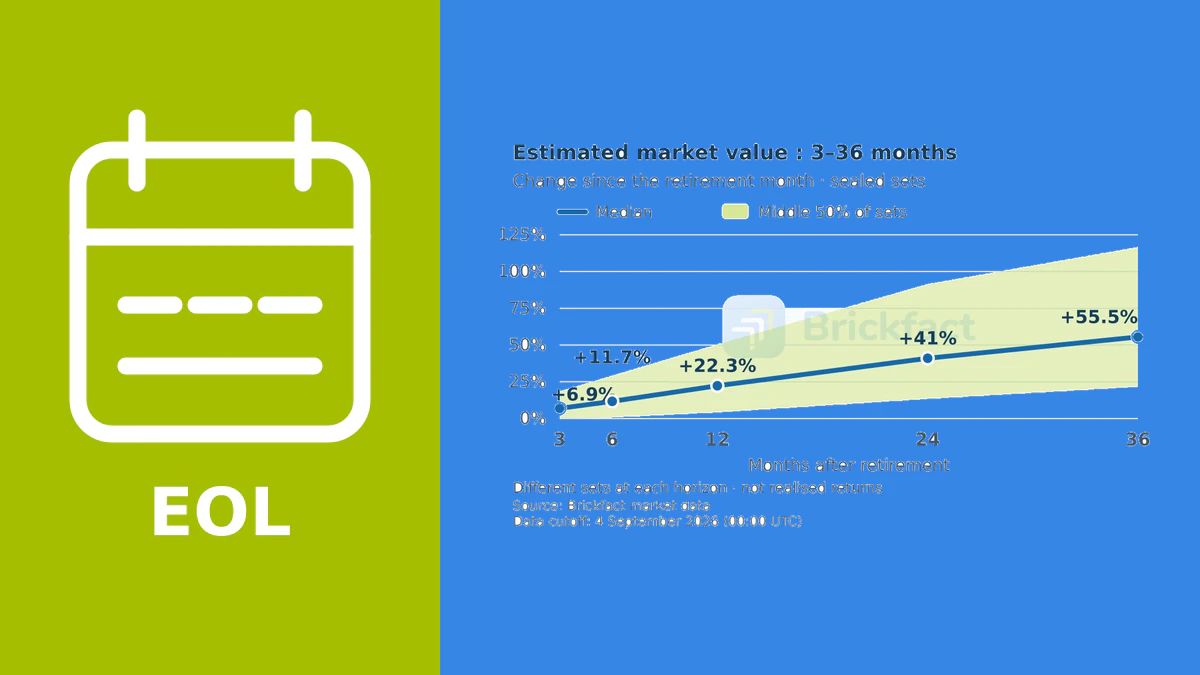
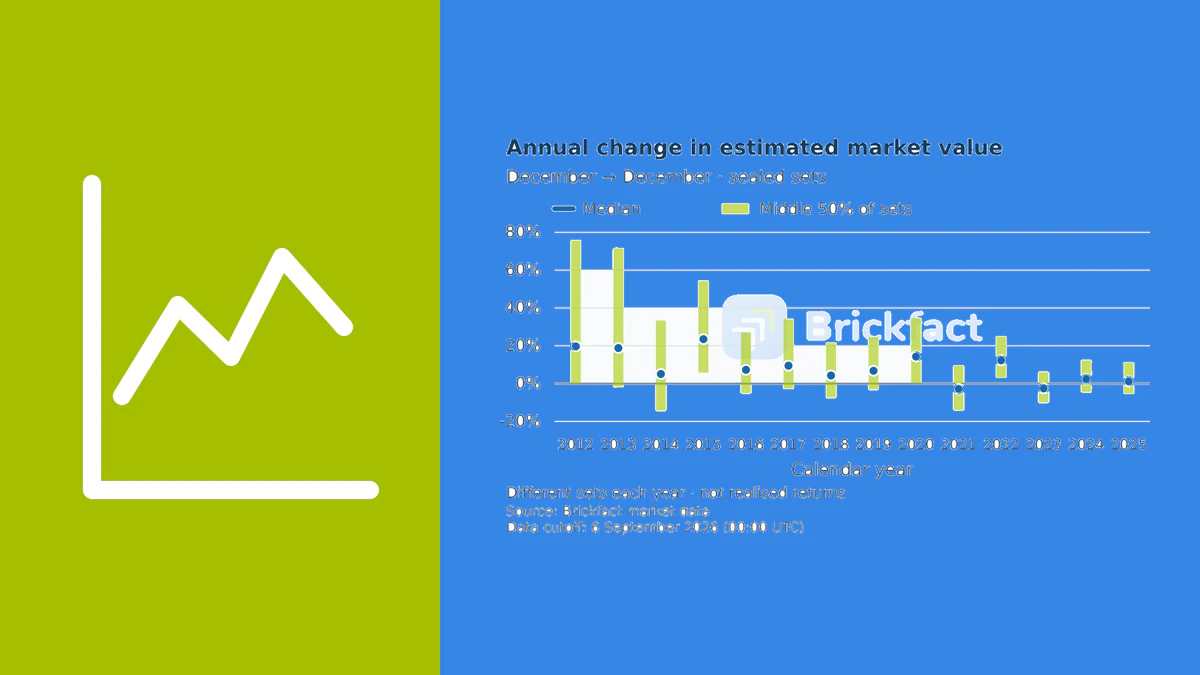
Over this period, shares and gold were clearly ahead. The period matters: most purchases date from 2022 to 2024, which were followed by strong years on the stock market and a sharp rise in the gold price, while the Lego market barely moved. Our study of Lego market performance shows this in the market values: in 2023, the median estimated value even fell slightly.
The comparison says nothing about whether Lego beats shares in the long run. It shows that, for most collectors, Lego was not the better investment in these years. Among the bargain hunters, on the other hand, almost one in two (44.5%) beat the ETF. For an older, more general comparison, see our article on Lego versus gold and shares; the figures here are based on real collections.
How much do Lego values swing?
The estimated value of a Lego collection fluctuates much less than a stock index, but only if it holds many sets. For this comparison we use Brickfact estimates for 1,479 sets with almost complete monthly values since January 2019 and build random collections of 1, 10, 25 and 50 sets from them. The ETF, the DAX and gold are also measured on monthly values, so both sides are treated the same way.
| Holding | Volatility a year | Largest drop (median) | Largest drop (worst 10%) |
|---|---|---|---|
| 1 Lego set | 22.4% | −31.5% | −55.1% |
| 10 Lego sets | 9.6% | −12.6% | −19.6% |
| 25 Lego sets | 7.3% | −9.7% | −14.9% |
| 50 Lego sets | 6.3% | −8.9% | −12.7% |
| MSCI World ETF | 14.5% | −24.7% | – |
| DAX | 16.7% | −28.2% | – |
| Gold (Xetra-Gold) | 11.6% | −17.5% | – |
At the median, a collection of 25 sets fluctuated by 7.3% a year, an MSCI World ETF by 14.5%. Its largest interim drop was −9.7%, against −24.7% for the ETF and −28.2% for the DAX. On top of that, Lego values move almost independently of the stock market: their correlation with the MSCI World is close to zero.
A single set, on the other hand, swings by 22.4% a year, more than the ETF, and at the median fell 31.5% below its peak at some point. The calm only comes from spreading money across many sets.
Two caveats apply. The values are estimates derived from offer prices, filtered and adjusted only gradually from day to day. Real sale prices move more, and selling costs fees. And low volatility is not the same as low risk: a collection can't be sold at its estimated value at the push of a button, and in these years the calmer values came with lower returns.
Selling: what’s left after fees
3,381 collectors sold 62,281 purchase lots and recorded a sale price. These sales are realised results, not estimates. We only include sets that were bought sealed and sold sealed.
| Holding period | Sales | Collectors | Median before costs | Median after 13% costs | At a loss before costs | At a loss after costs | Median a year |
|---|---|---|---|---|---|---|---|
| under 6 months | 14,685 | 2,118 | +33.1% | +15.8% | 7.3% | 29.3% | – |
| 6–12 months | 8,133 | 1,272 | +38.4% | +20.4% | 8.4% | 24.8% | – |
| 1–2 years | 15,090 | 1,534 | +41.0% | +22.7% | 8.1% | 23.1% | +26.4% |
| 2–3 years | 12,453 | 1,236 | +40.0% | +21.8% | 10.5% | 25.8% | +14.5% |
| 3–5 years | 10,485 | 996 | +43.4% | +24.7% | 11.5% | 25.3% | +10.4% |
| over 5 years | 1,435 | 290 | +87.7% | +63.3% | 8.4% | 18.3% | +10.3% |
| All sales | 62,281 | 3,381 | +39.2% | +21.1% | 9.0% | 25.6% | – |
At the median, a sale fetched +39.2% over the purchase price. But the recorded sale prices usually don’t include fees, shipping or taxes. Deduct a flat 13% for marketplace fees and shipping, and the median falls to +21.1%, with 25.6% of sales ending in a loss. The longer a set is held, the larger the total gain, but the lower the return per year: from +26.4% a year after one to two years to +10.4% after three to five years.
When buying pays off
For purchases made in 2022 and 2023, the result depends heavily on where the set was in its life cycle. A set retires (EOL, end of life) when Lego stops producing it.
| When bought | Purchases | Collectors | Paid (median, % of RRP) | Median value gain | At a loss |
|---|---|---|---|---|---|
| more than 12 months before retirement | 123,472 | 9,569 | 70.0% | +11.6% | 33.7% |
| in the final 12 months before retirement | 115,467 | 9,124 | 72.2% | +31.5% | 19.8% |
| after retirement | 106,256 | 8,335 | 80.0% | +45.5% | 14.5% |
Sets bought more than a year before retirement gained a median +11.6%, and a third of those purchases (33.7%) are at a loss. Purchases in the final year before retirement reached +31.5%, and purchases after retirement +45.5%. Buying late costs more, a median 80.0% of RRP instead of 70.0%, but it targets sets whose value trend is already visible. Our study of Lego prices after retirement covers this in more detail.
Before retirement, a large discount is the norm. Since January 2023, the median discount has been between 26.7% and 31.4% in every month:
| Month | Purchases | Median discount to RRP |
|---|---|---|
| January | 19,514 | 28.6% |
| February | 17,920 | 30.0% |
| March | 19,151 | 28.0% |
| April | 15,152 | 28.3% |
| May | 23,399 | 26.7% |
| June | 17,668 | 28.0% |
| July | 16,124 | 30.0% |
| August | 14,501 | 28.0% |
| September | 17,753 | 30.0% |
| October | 21,320 | 29.1% |
| November | 21,868 | 31.3% |
| December | 9,488 | 31.4% |
November and December are the cheapest months, May the most expensive. But the differences between months are small compared with the difference between a good offer and an average one. What helps most is waiting until the price is right. The current Lego deals and price alerts in the Brickfact app help with that.
What Lego collectors own
Half of the money invested sits in three themes. Star Wars leads clearly with 27.4%; in the 2024 study, Star Wars accounted for 26.6% of all purchases. The table is a census, not a buying recommendation. The columns on the right show the median value gain of purchases made in 2022 and 2023 up to today.
| Theme | Share of money invested | Collectors | Bought 2022–2023: median | Bought 2022–2023: at a loss |
|---|---|---|---|---|
| Star Wars | 27.4% | 10,459 | +24.0% | 26.0% |
| Icons | 15.7% | 8,444 | +13.1% | 29.5% |
| Technic | 7.2% | 5,353 | +40.4% | 12.3% |
| Ideas | 7.1% | 7,037 | +26.1% | 19.5% |
| Harry Potter | 6.8% | 6,572 | +28.4% | 16.9% |
| Marvel Super Heroes | 3.5% | 5,842 | +27.0% | 23.3% |
| NINJAGO | 3.0% | 3,192 | +74.4% | 4.4% |
| Architecture | 2.7% | 4,487 | +16.3% | 28.6% |
| Speed Champions | 2.6% | 5,885 | +34.9% | 15.8% |
| City | 2.6% | 3,441 | +35.3% | 17.9% |
Seven of the most-owned sets are Star Wars sets, mostly small and mid-sized ones. The count is of collectors who currently own the set:
| Set no. | Set | Collectors holding it |
|---|---|---|
| 75317 | The Mandalorian & the Child | 2,927 |
| 75304 | Darth Vader Helmet | 2,372 |
| 75333 | Obi-Wan Kenobi’s Jedi Starfighter | 2,325 |
| 21319 | Central Perk | 2,283 |
| 75320 | Snowtrooper Battle Pack | 2,205 |
| 40539 | Ahsoka Tano | 2,140 |
| 75280 | 501st Legion Clone Troopers | 2,005 |
| 21028 | New York City | 1,939 |
| 21034 | London | 1,934 |
| 75301 | Luke Skywalker’s X-Wing Fighter | 1,913 |
2024 and 2026 compared
In 2024, our first study reported an average annual return of 15.63%. That figure was a mean, pulled up by a few very high values. To make the two editions comparable, we applied the new rules to a cut-off at the end of 2023:
| Measure | 2024 study (published) | Same rules, cut-off end of 2023 | 2026 study |
|---|---|---|---|
| Median a year | 10.8% | 9.7% | 7.0% |
| 25th percentile | 2.7% | 1.5% | 3.4% |
| 75th percentile | 21.0% | 19.3% | 10.8% |
| Negative return | 19.5% | 22.0% | 12.1% |
| Mean | 15.6% | 13.6% (without top/bottom 5%) | 7.5% (without top/bottom 5%) |
| Collectors | – | 11,645 | 12,931 |
Under the same rules, the median at the end of 2023 was 9.7% and the mean without the extreme 5% was 13.6%, close to the 2024 figures. The earlier results hold up. Since then, the median has fallen to 7.0%, over a period in which the Lego market barely grew. At the same time, the share of collectors with a negative return has dropped from 22.0% to 12.1%.
What this means for you
- Don’t buy at RRP. The same sets that do well when bought at a big discount earn very little when bought at full price.
- Count the costs. Selling easily costs 10 to 15% of the proceeds. Only after that do you know what you’ve really made.
- Compare honestly. In recent years, a broad ETF would have earned most collectors more. Lego is a hobby that often gains value, but rarely a substitute for a diversified investment.
- Keep an eye on your numbers. The Brickfact Lego collection tracker shows what you paid and what your sets are worth today.
Methodology
Data. The study is based on portfolio transactions that users enter themselves in the Brickfact app or on the website: set, date, quantity, price per set and condition. Positive quantities are purchases, negative quantities are sales. The data was read on 14 October 2026 and covers transactions up to and including 30 September 2026. All analysis is anonymous. Individual users cannot be identified, every published group contains at least 50 collectors, and every theme and set at least 100.
Selection. We include collectors with at least ten transactions recorded only in euros. We exclude accounts with obvious entry errors (quantities above 100 or prices above €20,000 per set), purchases at €0 such as gifts or free promotional sets, purchases below 30% of RRP, which are often entry errors or bulk collection buys, and purchases before 2010. Collectors for whom more than 10% of the sets still held have no market value are also excluded. That leaves 12,931 collectors.
Valuation. Sales are matched to the oldest remaining purchases of the same set (first in, first out). Sets still held are valued at the Brickfact estimate for sealed sets: the median of daily values in the most recent month between April and September 2026 with at least ten days of observations, multiplied by the recorded condition. The annual return is the internal rate of return of all of a collector’s cash flows up to 30 September 2026.
Benchmarks. For the comparison, we use daily closing prices of the iShares Core MSCI World UCITS ETF (accumulating, Xetra), Xetra-Gold and the DAX. Each of a collector’s cash flows goes into, or comes out of, the benchmark on the same day. A collector did better if their final wealth exceeds that of the benchmark (public market equivalent).
Volatility. For the volatility comparison we use monthly values, the median of daily values, from January 2019 to September 2026. Sets need values in at least 90% of months; gaps of up to two months carry the last value. For each size we draw 2,000 random collections with equal starting weights and report the median. The ETF, the DAX and gold are calculated the same way from monthly medians of daily closes. This selection favours established sets, so it describes swings, not returns.
Purchase price groups. The group is based on the median ratio of purchase price to RRP across all of a collector’s purchases. The typical price of a set is the median of all recorded sealed purchases of that set in the same calendar year.
The analysis is reproducible: the query, the analysis script and the aggregated results are kept in our repository. Raw data on individual users never leaves the database.
Limitations
- Self-reported data. The figures describe transactions recorded by participating Brickfact users who maintain their collections voluntarily, not all Lego buyers. Entry errors cannot be ruled out entirely.
- Estimated values. For sets still held, the gain is a paper gain based on an estimate, not actual sale proceeds. The costs of selling later are not included.
- Current RRP. We compare with the RRP on record today. Where Lego raised an RRP later, discounts on older purchases look larger than they were at the time.
- Costs and taxes. Storage, shipping, time and any taxes are not included.
- Volatility from estimates. The volatility figures are based on estimated values of established sets, not on sale prices.
- Period. The results apply to the period up to September 2026. Other periods may look very different.
- No guarantee. Past returns are no guarantee of future returns. This study is not investment advice.
Robustness
The results barely change when we cut the sample differently:
| Analysis | Collectors | Median a year | Middle half | Negative | Beat an MSCI World ETF |
|---|---|---|---|---|---|
| Main analysis | 12,931 | 7.0% | 3.4% to 10.8% | 12.1% | 12.0% |
| Only purchases recorded promptly (≥ 80%) | 7,863 | 7.3% | 3.2% to 11.9% | 13.7% | 14.9% |
| First purchase in 2022 or later | 7,764 | 6.8% | 2.6% to 11.5% | 16.0% | 14.0% |
| At least €5,000 invested | 2,748 | 8.0% | 4.9% to 11.2% | 7.1% | 11.6% |
Frequently asked questions
Is Lego a good investment?
For most collectors in our analysis, Lego produced a moderate gain: 7.0% a year at the median, with 12.1% in the red. With the same cash flows, an MSCI World ETF would have returned a median 15.5%. Collectors who consistently buy at big discounts earn considerably more.
Is Lego less risky than shares?
The estimated value of a collection of many sets fluctuates about half as much as an MSCI World ETF and moves independently of the stock market. Single sets, however, swing more than the ETF, and selling costs money and time in fees and finding buyers. Smaller swings are therefore not automatically lower risk.
How big a discount do I need?
In our data, every extra bit of discount means more return. Collectors who usually buy at least 40% below RRP earn 14.2% a year; collectors with discounts below 20% earn 4.4%.
Why is the result lower than in 2024?
The 2024 study reported a mean that a few outliers pulled up. Under today’s rules, the median at the end of 2023 was 9.7%. Since then the Lego market has barely grown, and the median has fallen to 7.0%.
Are the figures representative?
They describe transactions recorded by participating Brickfact users, not all Lego buyers. Dedicated collectors are probably over-represented in this group.