Ninjago had the strongest median gain among the qualifying Lego themes in the latest complete rolling year. Between August 2025 and August 2026, its 303 sampled sets gained a median +10.0%, followed by DC Comics Super Heroes at +9.7% and Minecraft at +6.0%. These are changes in nominal euro estimates for sealed sets, not observed sale prices or investor profits.
Across the broader sample of 5,837 sets, the median was +1.7%, while the arithmetic mean reached +6.2%. Yet 42.7% of sets had unchanged or lower estimates. A positive theme result therefore needs context: how widely were gains shared, did the theme qualify in earlier years, and which sets survived the coverage requirements?
The data was extracted on 7 September 2026 with a cutoff strictly before 00:00 UTC that day. The latest observation month ends on 31 August. This is neither calendar-year 2026 performance nor a year-to-date return.
Latest year: August 2025 to August 2026
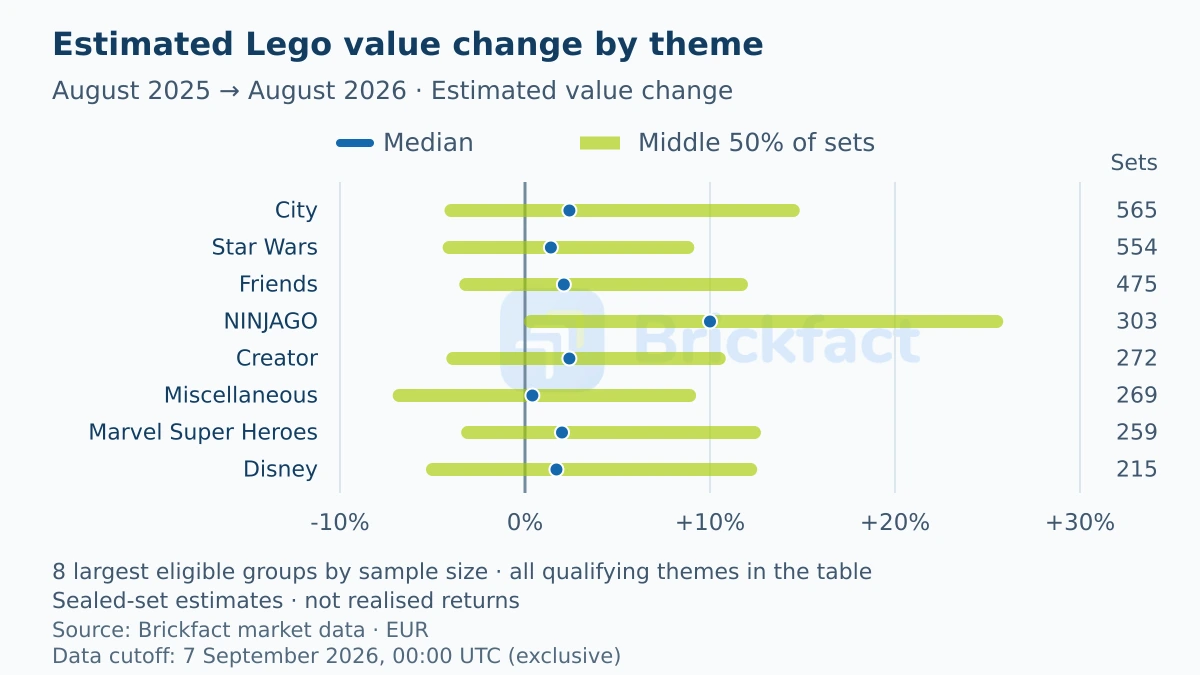
The comparison includes every catalogue category with at least 100 eligible sets for this period, not a selection of familiar investment themes. The table contains all 16 qualifying themes plus the broader benchmark. The chart selects at most eight qualifying themes by sample size, not the eight strongest gains; smaller eligible themes remain visible in the table.
| Theme | Sets | 25th percentile | Median change | 75th percentile | Mean change | No positive change |
|---|---|---|---|---|---|---|
| Broader sample | 5,837 | −4.2% | +1.7% | +11.9% | +6.2% | 42.7% |
| Technic | 204 | −5.7% | +0.3% | +7.4% | +0.1% | 47.1% |
| City | 565 | −4.0% | +2.4% | +14.5% | +6.9% | 41.1% |
| Disney | 215 | −5.0% | +1.7% | +12.2% | +4.6% | 42.3% |
| Star Wars | 554 | −4.1% | +1.4% | +8.8% | +2.6% | 42.4% |
| NINJAGO | 303 | +0.3% | +10.0% | +25.5% | +20.1% | 23.1% |
| Icons | 125 | −5.2% | +0.3% | +6.6% | +0.8% | 46.4% |
| DUPLO | 215 | −4.2% | −0.1% | +13.8% | +7.4% | 57.2% |
| Promotional | 175 | −6.5% | −0.3% | +10.0% | +4.3% | 60.6% |
| Friends | 475 | −3.2% | +2.1% | +11.7% | +6.6% | 39.6% |
| Marvel Super Heroes | 259 | −3.1% | +2.0% | +12.4% | +5.3% | 41.7% |
| Miscellaneous | 269 | −6.8% | +0.4% | +8.9% | +1.1% | 48.0% |
| Harry Potter | 117 | −1.7% | +4.3% | +12.4% | +7.7% | 32.5% |
| Minecraft | 120 | −2.5% | +6.0% | +20.9% | +11.8% | 35.8% |
| BrickHeadz | 127 | −8.8% | −2.9% | +1.6% | −2.8% | 65.4% |
| DC Comics Super Heroes | 114 | +2.0% | +9.7% | +21.9% | +21.5% | 21.9% |
| Creator | 272 | −3.9% | +2.4% | +10.5% | +4.2% | 40.4% |
Star Wars had 554 eligible sets and a median of +1.4%. Technic and Icons each showed +0.3%, despite different sample sizes and distributions. BrickHeadz was negative at −2.9%, with 65.4% of its 127 sets showing no positive change. Theme familiarity alone does not tell you where the typical observed set finished.
Equal displayed medians remain ties; extra decimal places should not manufacture distinctions. Super Mario illustrates the eligibility boundary: its 99 sets and +8.9% median do not qualify it for this table. The rule was fixed before inspecting gains. Our Lego market performance study provides the broader historical context rather than another theme ranking.
Typical sets, arithmetic means and outliers
The median gives the middle of the individual set changes. Each set carries equal weight, so an expensive collector model does not count more than a small set. The 25th and 75th percentiles bracket the middle half of those changes. They describe variation between sets, not a confidence interval for the median or a forecast range for your collection.
Ninjago's recent median of +10.0% sits below its +20.1% mean. For DC Comics Super Heroes, the median is +9.7% and the mean +21.5%. These gaps signal an asymmetric distribution in which larger gains can pull up the average. They do not reveal how many exceptional sets caused the gap or what share of growth those sets contributed. That would require a separate concentration analysis.
Ninjago's middle half spans +0.3% to +25.5%, while 23.1% did not gain. Both facts matter: the positive lower quartile indicates a broadly positive sample, but the theme name did not protect every set. DUPLO shows why the mean alone is inadequate: its positive average accompanies a slightly negative median. None of these equal-set summaries is a portfolio return.
Consistency across annual comparisons, 2019–2025
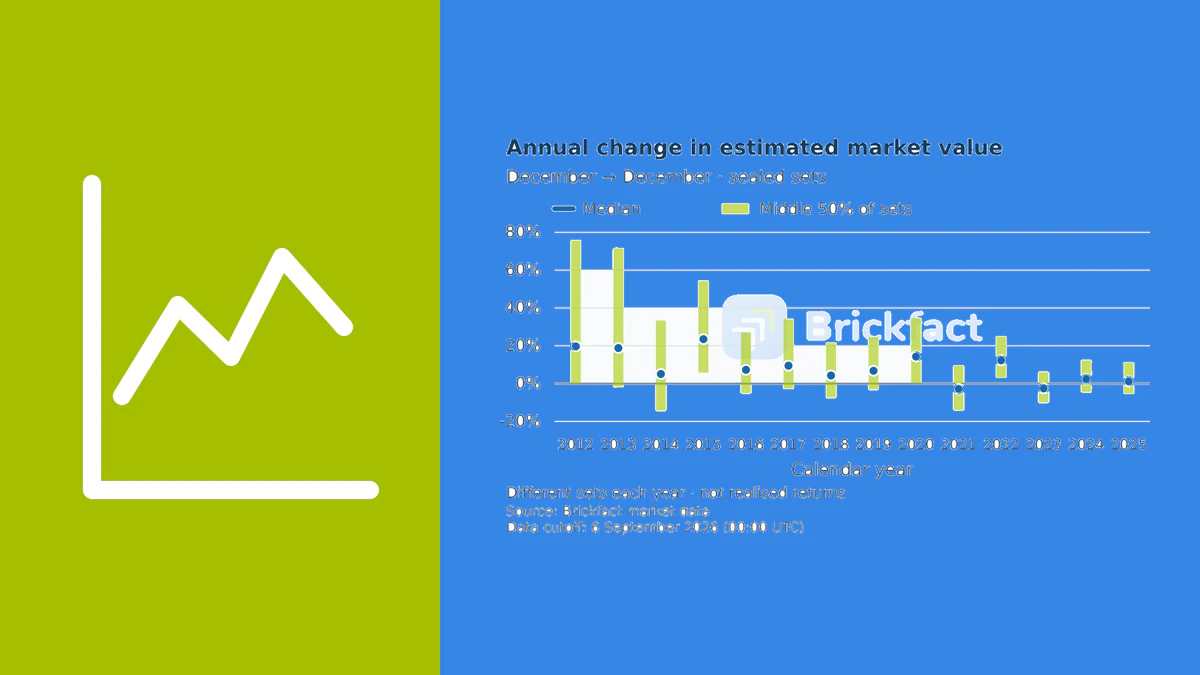
Each annual comparison runs from the previous December to December of the stated year. A theme qualifies for an annual count only with at least 100 paired sets at the main ten-day threshold. The table follows the recent theme order, but its eligible-year denominator varies. A zero in that first numeric column means no qualifying annual comparison, not seven years without growth.
| Theme | Eligible years | Positive displayed median | Above displayed benchmark |
|---|---|---|---|
| Technic | 7 | 5 | 3 |
| City | 7 | 5 | 3 |
| Disney | 4 | 3 | 1 |
| Star Wars | 7 | 7 | 6 |
| NINJAGO | 7 | 7 | 6 |
| Icons | 3 | 2 | 1 |
| DUPLO | 6 | 4 | 2 |
| Promotional | 4 | 1 | 0 |
| Friends | 7 | 3 | 0 |
| Marvel Super Heroes | 4 | 3 | 1 |
| Miscellaneous | 2 | 1 | 0 |
| Harry Potter | 1 | 1 | 1 |
| Minecraft | 0 | 0 | 0 |
| BrickHeadz | 2 | 1 | 1 |
| DC Comics Super Heroes | 3 | 2 | 3 |
| Creator | 7 | 5 | 0 |
Ninjago and Star Wars each qualified in seven years, had seven positive displayed medians and exceeded the corresponding broader median in six. Their latest-year results differ, however. Historical consistency and the strongest recent gain are separate questions. DC Comics Super Heroes exceeded the benchmark in all three eligible years but had a positive median in only two; beating a declining benchmark need not mean gaining value.
Minecraft's recent result cannot supply the annual evidence it lacks under this rule. Counts use published one-decimal medians: a rounded tie is not a win. The sets change and overlap across years, so these are neither independent trials nor a fixed collection's record. Annual medians must never be compounded into a market index.
Longer periods: total growth and annualized change
Longer comparisons pair their own starting and ending months. Each theme must independently reach 100 sets in that period. Missing a long-period table means failing that coverage or sample rule, not necessarily falling in value. The shorter and longer windows do not track identical membership.
Three years: August 2023 to August 2026
| Theme | Sets | 25th percentile | Median change | Median annualized change (CAGR) | 75th percentile | No positive change |
|---|---|---|---|---|---|---|
| Broader sample | 4,841 | −3.2% | +11.4% | +3.7% | +32.6% | 31.3% |
| Technic | 160 | −2.1% | +9.6% | +3.1% | +31.5% | 32.5% |
| City | 489 | −0.3% | +12.3% | +3.9% | +32.1% | 26.8% |
| Disney | 154 | −0.7% | +13.4% | +4.3% | +31.9% | 26.0% |
| Star Wars | 487 | +1.7% | +12.9% | +4.1% | +27.0% | 20.9% |
| NINJAGO | 277 | +23.7% | +45.7% | +13.4% | +86.7% | 6.5% |
| DUPLO | 177 | −8.8% | +7.7% | +2.5% | +38.2% | 41.8% |
| Promotional | 167 | −12.0% | −2.3% | −0.8% | +11.5% | 57.5% |
| Friends | 400 | −8.5% | +3.8% | +1.3% | +19.3% | 41.0% |
| Marvel Super Heroes | 206 | −5.4% | +6.2% | +2.0% | +25.2% | 36.4% |
| Miscellaneous | 131 | −16.3% | −0.6% | −0.2% | +14.3% | 52.7% |
| BrickHeadz | 112 | −9.3% | +1.4% | +0.5% | +17.4% | 42.0% |
| DC Comics Super Heroes | 104 | −0.6% | +16.6% | +5.3% | +36.1% | 26.9% |
| Creator | 234 | −7.8% | +5.6% | +1.8% | +23.9% | 38.0% |
The broader three-year sample contains 4,841 sets with a median total change of +11.4% and a median per-set annualized change of +3.7%. Ninjago's 277 sets show +45.7% total and +13.4% annualized. Its middle half is positive, although 6.5% still had no positive change. DC Comics Super Heroes follows at a total median of +16.6%, while Star Wars reaches +12.9%.
BrickHeadz has a positive three-year median despite its negative latest year. Promotional remains negative over three years. These are comparisons of separate endpoint samples, not enough information to locate a peak or reconstruct the intervening path. A positive three-year endpoint does not establish uninterrupted growth along the way.
Five years: August 2021 to August 2026
The five-year chart again selects qualifying themes by sample size, with a maximum of eight. Only seven themes meet the period's eligibility rule; the table also includes the broader benchmark. It reports total changes separately from annualized growth.
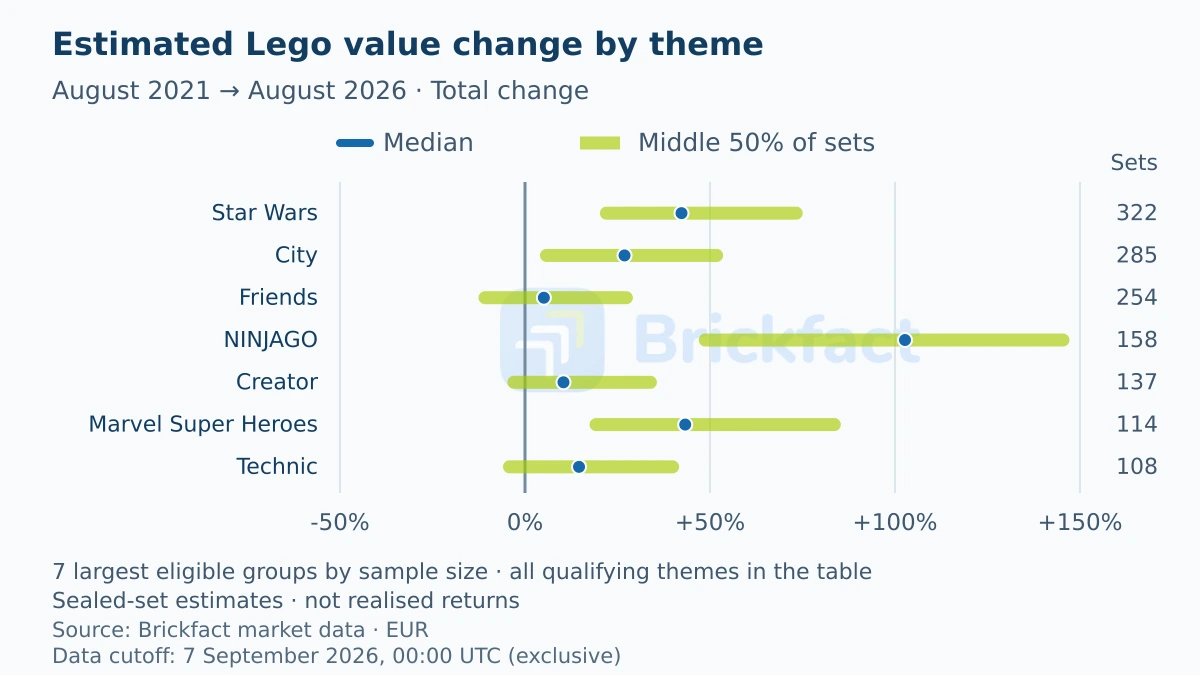
| Theme | Sets | 25th percentile | Median change | Median annualized change (CAGR) | 75th percentile | No positive change |
|---|---|---|---|---|---|---|
| Broader sample | 2,661 | +3.6% | +28.9% | +5.2% | +65.0% | 20.6% |
| Technic | 108 | −4.2% | +14.6% | +2.8% | +39.9% | 28.7% |
| City | 285 | +5.8% | +26.9% | +4.9% | +51.8% | 17.9% |
| Star Wars | 322 | +22.0% | +42.3% | +7.3% | +73.3% | 7.5% |
| NINJAGO | 158 | +48.7% | +102.7% | +15.2% | +145.4% | 0.6% |
| Friends | 254 | −10.8% | +5.1% | +1.0% | +27.4% | 41.7% |
| Marvel Super Heroes | 114 | +19.2% | +43.3% | +7.5% | +83.6% | 9.6% |
| Creator | 137 | −3.0% | +10.4% | +2.0% | +33.9% | 29.9% |
Ninjago's median total change is +102.7% across 158 sets, with a median per-set CAGR of +15.2%. Marvel Super Heroes and Star Wars also exceed the broader total median of +28.9%. Friends has a positive total median, but 41.7% of its eligible sets did not gain. A longer holding window did not make gains universal.
CAGR is calculated from each set's unrounded value ratio before taking the median. We neither divide total growth by five nor transform a rounded group median. Annualization gives a comparable yearly rate for the endpoint change; it does not say that rate occurred every year. The five-year sample also selects older sets with usable surviving observations, so it cannot establish what today's releases will do.
Sensitivity to the observed-day requirement
The main calculation requires at least ten distinct observed days in both endpoint months. Repeating it with twenty days changes eligibility rather than filling missing observations. The broader recent sample falls to 5,569 sets, with its displayed median still +1.7%. Theme results deserve separate inspection.
| Theme | Sets: 10 days | Median: 10 days | Sets: 20 days | Median: 20 days |
|---|---|---|---|---|
| Technic | 204 | +0.3% | 195 | +1.2% |
| City | 565 | +2.4% | 544 | +2.5% |
| Disney | 215 | +1.7% | 212 | +1.7% |
| Star Wars | 554 | +1.4% | 528 | +1.3% |
| NINJAGO | 303 | +10.0% | 280 | +8.6% |
| Icons | 125 | +0.3% | 122 | +0.5% |
| DUPLO | 215 | −0.1% | 191 | −0.1% |
| Promotional | 175 | −0.3% | 167 | −0.4% |
| Friends | 475 | +2.1% | 446 | +2.6% |
| Marvel Super Heroes | 259 | +2.0% | 249 | +2.2% |
| Miscellaneous | 269 | +0.4% | 264 | +0.5% |
| Harry Potter | 117 | +4.3% | 117 | +4.3% |
| Minecraft | 120 | +6.0% | 117 | +5.7% |
| BrickHeadz | 127 | −2.9% | 126 | −3.0% |
| DC Comics Super Heroes | 114 | +9.7% | 105 | +8.8% |
| Creator | 272 | +2.4% | 261 | +2.5% |
Ninjago's median becomes +8.6% and DC Comics Super Heroes reaches +8.8%, reversing their recent order at this threshold. Minecraft remains positive at +5.7%, while BrickHeadz remains negative at −3.0%. Broad directions can persist while the identity of the leading theme depends on coverage. That is more useful than declaring the ranking universally robust.
The stricter annual comparisons for 2024 and 2025 are unavailable. Both need December 2024, when the maximum recorded coverage was 18 days per set: no set meets twenty days. Those results have zero eligible sets and unavailable statistics, not zero growth. The successful recent comparison does not repair this annual gap, and the data does not establish its cause.
Age and recorded retirement: descriptive checks, not adjustment
Themes can contain different mixes of older and younger sets. The next table shows two separate slices of the recent-year sample: sets at least five years old at the August 2025 baseline, and sets with a recorded retirement month before that baseline. These are not jointly matched groups. A set may belong to both, and neither column controls for the other characteristic.
| Theme | At least 5 years old: sets | At least 5 years old: median | Retired before baseline: sets | Retired before baseline: median |
|---|---|---|---|---|
| Technic | 83 | −0.4% | 121 | +1.6% |
| City | 237 | +0.3% | 372 | +3.3% |
| Disney | 71 | +1.5% | 146 | +3.4% |
| Star Wars | 345 | +1.1% | 421 | +1.5% |
| NINJAGO | 140 | +15.8% | 214 | +11.7% |
| Icons | 41 | −0.9% | 65 | +0.3% |
| DUPLO | 81 | −0.1% | 124 | 0.0% |
| Promotional | 106 | −0.9% | 115 | −0.8% |
| Friends | 266 | +1.0% | 392 | +3.0% |
| Marvel Super Heroes | 111 | +1.5% | 187 | +2.3% |
| Miscellaneous | 18 | – | 47 | +2.1% |
| Harry Potter | 25 | – | 70 | +4.8% |
| Minecraft | 48 | +2.1% | 91 | +9.2% |
| BrickHeadz | 58 | −3.5% | 105 | −2.8% |
| DC Comics Super Heroes | 65 | +10.0% | 82 | +9.7% |
| Creator | 103 | +1.4% | 146 | +4.0% |
Among older sets, Ninjago's median is +15.8%; among those recorded as retired before the baseline, it is +11.7%. Technic has a negative older-set median but a positive recorded-retirement median. Such contrasts show why the composition question matters. They do not isolate a theme effect or justify averaging subgroup medians into an adjusted result.
Within the 5,837 recent sets, 1,095 have unknown or conflicting age and 1,534 have unknown or conflicting retirement information. The counts remain in the evidence rather than becoming assumed dates. Table dashes suppress statistics for fewer than 30 sets while retaining their counts. Harry Potter's 25 older sets are therefore not a zero-growth result.
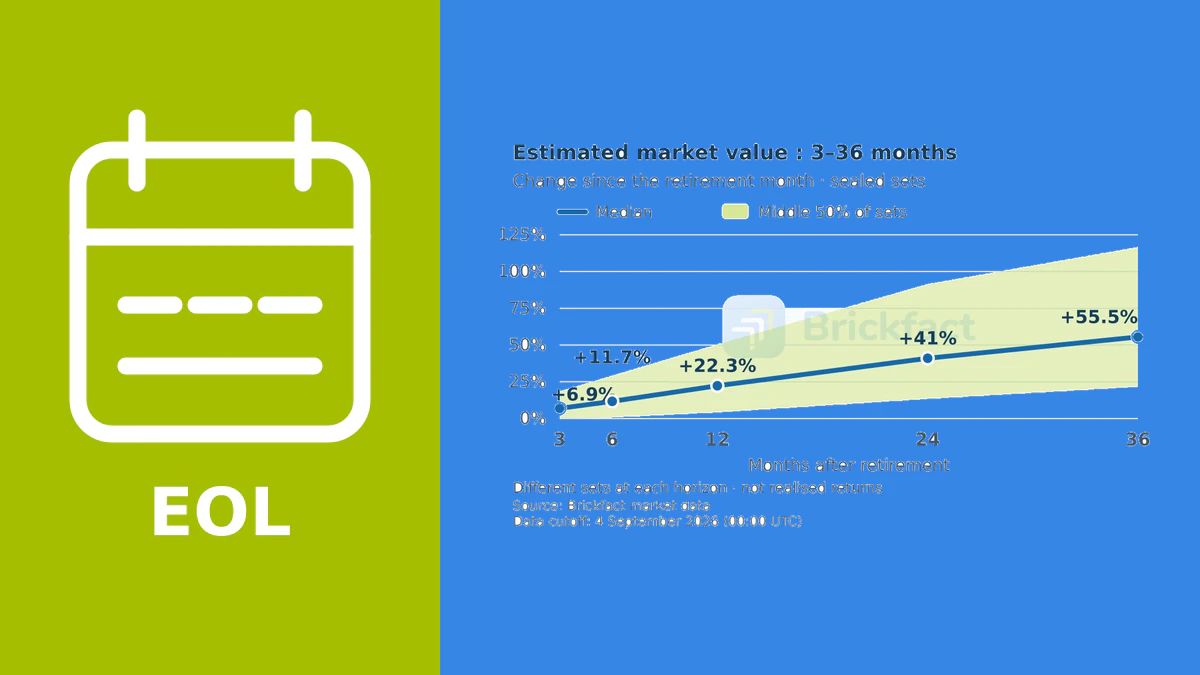
Release and retirement dates are current, mutable catalogue fields, not historical snapshots. Recorded retirement months may have been scheduled or revised; they do not prove actual retirement at the time. The study of Lego prices after retirement addresses the separate event-based question. This theme comparison establishes no age-and-retirement-adjusted overall result.
Methods, coverage and limits
The analysis uses Brickfact's operational estimated sealed-set values in euros and actual catalogue categories, including Promotional and Miscellaneous. Each set belongs to one category; we do not merge subthemes or retrospectively create brand groups. Current category assignments may differ from historical ones. The broader benchmark includes the theme samples and is not an independent control.
Valid duplicates are averaged per set and UTC day; the monthly value is the median of those daily means. Both endpoint months must qualify before calculating each set's unrounded percentage change. We apply no price-floor clipping, ceilings, winsorization or gain-based exclusions. Missing days are not filled or carried forward. “No positive change” includes unchanged estimates and declines, classified before rounding.
The endpoint-month input contains 1,629,328 rows: 1,626,698 valid, 2,629 null and one otherwise-valid row without a matching catalogue identity. Valid rows collapse to 1,626,084 observed set-days. Deduplicating reused observations across all main comparisons leaves 7,668 unique sets, 55,264 set-months and 1,396,942 observed set-days. Those are overall used-coverage counts, not the recent denominator of 5,837 sets; repeated windows must not be added as independent evidence.
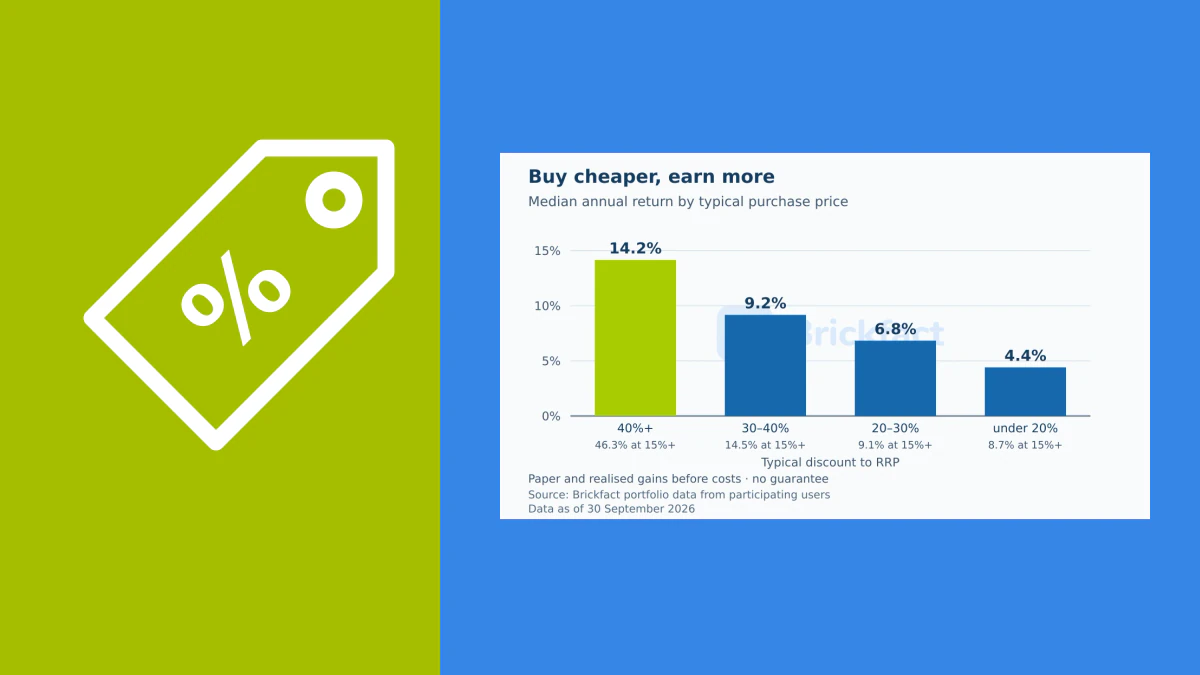
The upstream operational series includes transformations and smoothing. A recorded estimate-day is not necessarily a fresh independent quote, an unprocessed offer or a transaction. This study uses no user portfolios or transaction data. Historical availability, survivorship and later catalogue edits limit interpretation. Nominal estimated changes omit purchase discounts, spreads, selling fees, taxes, inflation, storage, damage and liquidity; they cannot establish realizable net profit.
What the results mean for your own sets
Ninjago has strong descriptive results across these eligible periods, but the evidence does not turn a theme into a buying rule. Start with the individual model: the Lego value checker lets you inspect its estimated value and history rather than assign it the theme median. Your acquisition price and achievable selling price remain separate from that estimate.
Use our guide to investing in Lego for the practical considerations around holding and selling. Read the theme tables as context: compare the median with the spread, check the denominator and distinguish a long endpoint gain from annual consistency. No theme-level result here guarantees appreciation, a buyer when you need one, or a profit after costs.