Estimated Lego set values edged upwards in the latest complete calendar-year comparison, but nearly half the sampled sets did not rise. Between December 2024 and December 2025, the median change was +1.2% across 5,829 sets. For 45.1% of those sets, the estimated value was unchanged or lower.
The longer history is not a story of uninterrupted growth either. The annual median was negative in 2021 and 2023. A separate group of 815 sets with consistent December coverage gained a median +80.2% in total over ten years, equivalent to a median per-set annualized rate of +6.1%. Those are changes in estimated sealed-set values, not returns earned by investors.
Data cutoff: 6 September 2026, 00:00 UTC. This study uses nominal euro estimates and completed calendar months only. The latest rolling-year comparison ends in August 2026; it is not a result for the full 2026 calendar year.
What does “Lego market performance” mean here?
We compare the estimated value of the same set in two months, then summarize the percentage changes across the eligible sets. For each calendar year, the starting point is the previous December and the endpoint is December of the stated year. The 2025 row therefore compares December 2024 with December 2025, not January with December and not the first and last trading day of the year.
Each monthly value is the median of recorded daily values. A set needs at least ten recorded days in both endpoint months to qualify. Every qualifying set gets the same weight, regardless of its price or popularity. We do not restrict the sample to sets currently marked as retired.
The median describes the middle of the set-level changes, not the change in the combined value of a collection. The 25th and 75th percentiles enclose the middle half of the sampled sets. “No positive change” includes both declines and exactly unchanged estimates, measured before rounding.
This is not a representative Lego market index. The eligible sets change from year to year as historical coverage changes. The annual comparisons and the separate fixed-panel comparison answer different questions and should not be combined into a single performance curve.
Annual changes: modest recent gains, with negative years in between
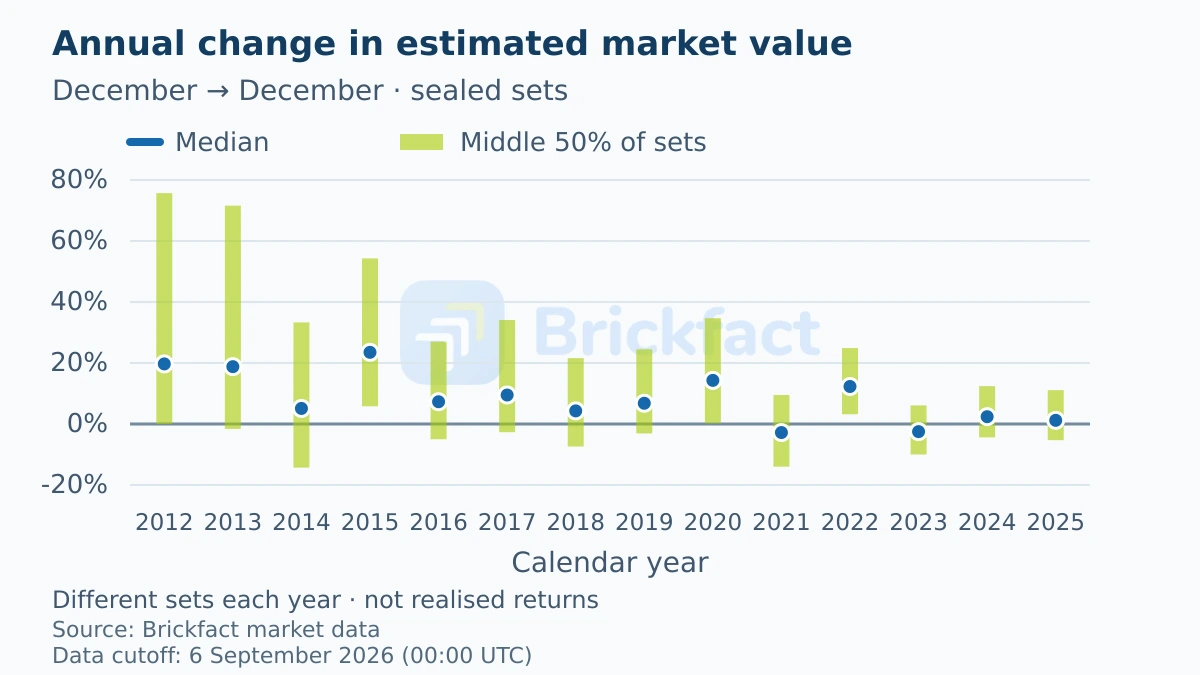
The strongest median in these annual samples was +23.5% in 2015, when 1,044 sets qualified. In 2020 the median was +14.3%, followed by −2.8% in 2021. After +12.3% in 2022, the median fell again to −2.5% in 2023. The two most recent full calendar-year comparisons were smaller: +2.4% in 2024 and +1.2% in 2025.
| Year (Dec to Dec) | Sets | 25th percentile | Median change | 75th percentile | No positive change |
|---|---|---|---|---|---|
| 2012 | 374 | 0.0% | +19.7% | +75.7% | 25.9% |
| 2013 | 590 | −1.6% | +18.8% | +71.6% | 28.1% |
| 2014 | 823 | −14.3% | +5.1% | +33.3% | 43.4% |
| 2015 | 1,044 | +5.8% | +23.5% | +54.3% | 18.1% |
| 2016 | 1,304 | −5.0% | +7.3% | +27.0% | 36.6% |
| 2017 | 1,592 | −2.7% | +9.5% | +34.1% | 31.7% |
| 2018 | 1,902 | −7.4% | +4.3% | +21.6% | 41.4% |
| 2019 | 2,213 | −3.1% | +6.8% | +24.5% | 34.5% |
| 2020 | 2,428 | +0.2% | +14.3% | +34.7% | 24.6% |
| 2021 | 2,433 | −14.0% | −2.8% | +9.5% | 55.9% |
| 2022 | 4,372 | +3.2% | +12.3% | +24.9% | 15.9% |
| 2023 | 5,779 | −10.0% | −2.5% | +6.1% | 61.1% |
| 2024 | 5,394 | −4.4% | +2.4% | +12.4% | 39.7% |
| 2025 | 5,829 | −5.3% | +1.2% | +11.1% | 45.1% |
A positive median does not mean every set gained value. In 2025, the middle half ranged from −5.3% to +11.1%, and 45.1% had no positive change. In 2023, the no-positive-change share was 61.1%. That variation matters more for the owner of a particular set than the sign of the overall median alone.
The sample also grows from 374 sets in 2012 to 5,829 in 2025, with a substantial change in coverage around 2022. These are not annual readings of an unchanged basket. The table describes the observed groups; it cannot establish that the entire Lego market slowed by the same amount, or explain why prices moved. In particular, compounding these medians would mix different sets into an invented index.
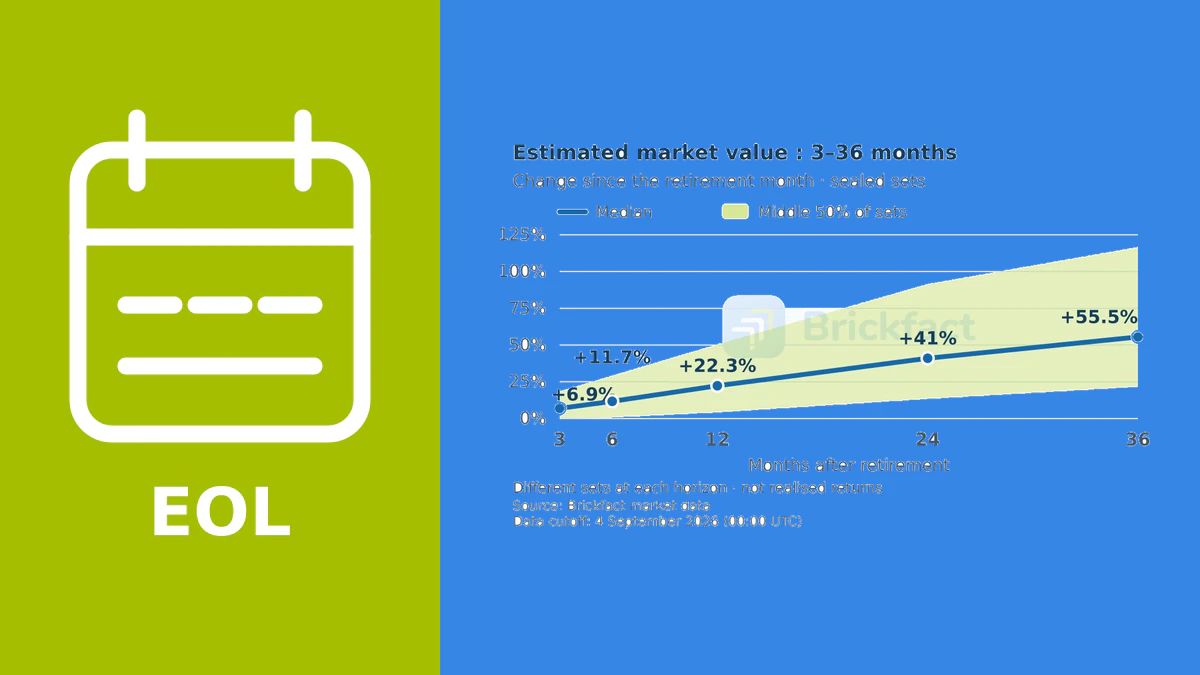
Calendar time is also different from time since a set left production. Our separate study of Lego prices after retirement aligns sets by their retirement month rather than by a shared calendar year.
The latest complete twelve months: August 2025 to August 2026
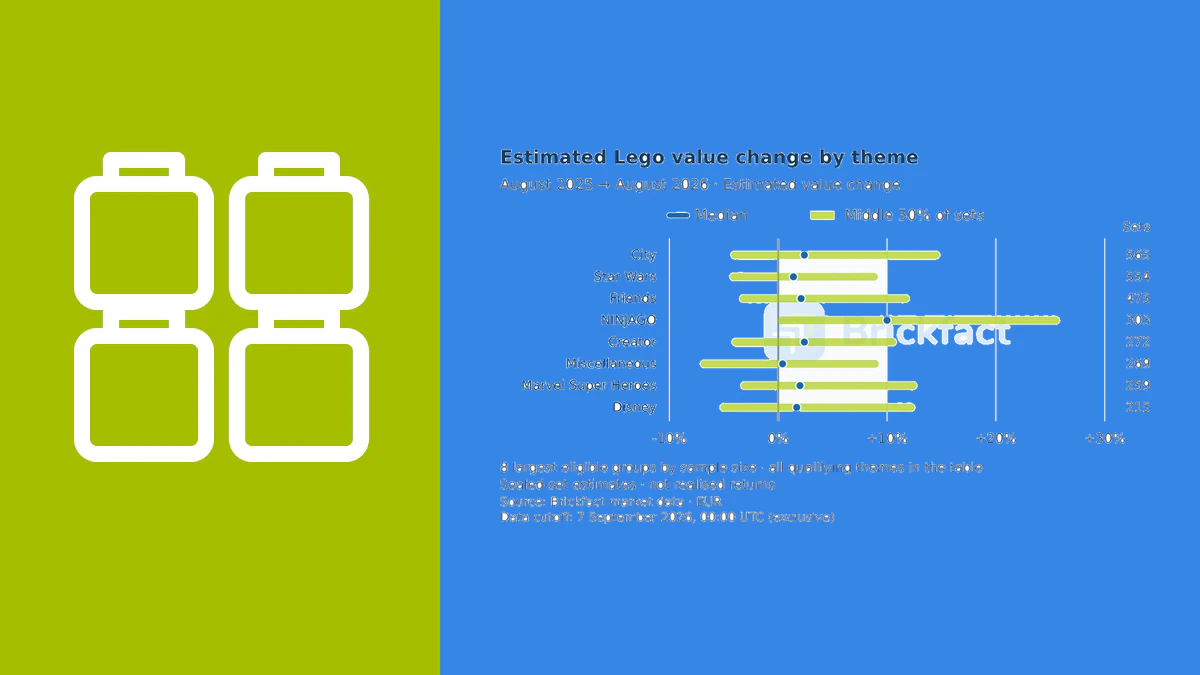
To provide a more recent comparison without treating an unfinished year as complete, we also compare August 2025 with August 2026. The median change was +1.7% across 5,837 sets. The middle half ranged from −4.2% to +11.9%, while 42.7% had no positive change.
| Comparison | Sets | 25th percentile | Median change | 75th percentile | No positive change |
|---|---|---|---|---|---|
| Aug 2025 → Aug 2026 | 5,837 | −4.2% | +1.7% | +11.9% | 42.7% |
This is a complete twelve-month interval between monthly estimates. It is not 2026 year-to-date performance, and it should not be spliced into the December-to-December chart as another calendar-year point. Its membership is determined independently by coverage in the two August months.
What happened to the same 815 sets over ten years?
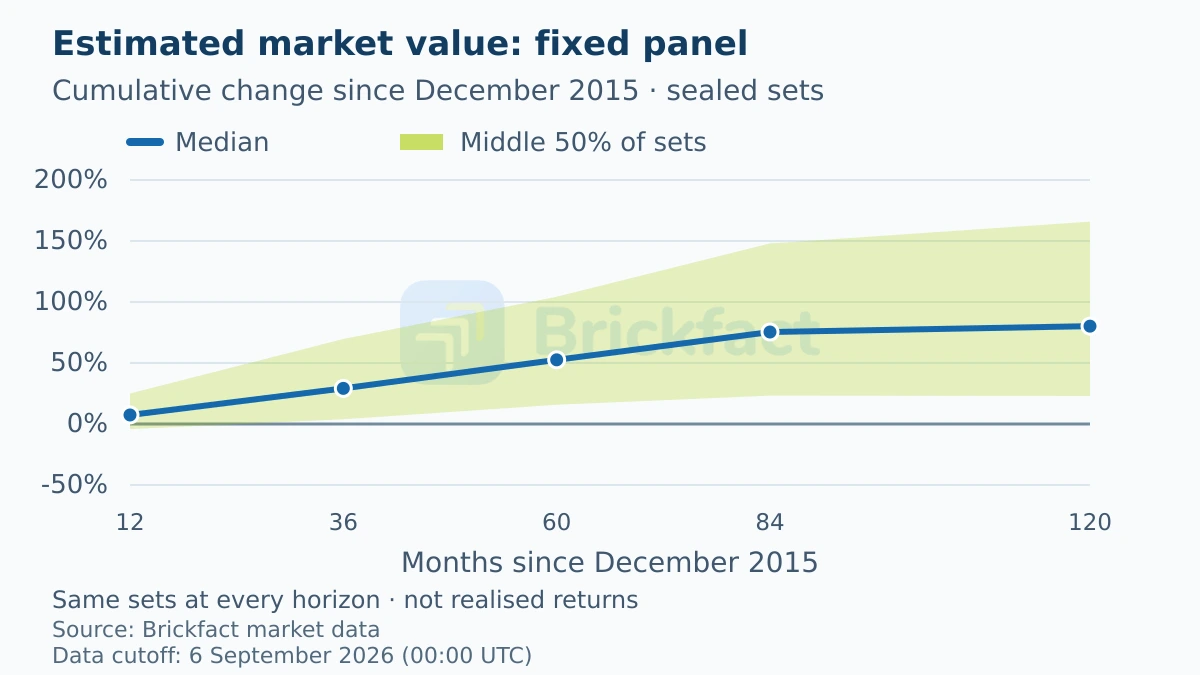
A changing sample makes long-term interpretation difficult. For a second view, we selected sets with at least ten recorded days in every December from 2015 through 2025. That leaves a fixed group of 815 sets, used at every displayed horizon. December 2015 is the baseline throughout.
For this group, the median estimated-value change reached +80.2% cumulatively by December 2025. The median per-set annualized change was +6.1%. These are different descriptions of the endpoint changes: the first covers the whole decade; the second expresses each set’s change as an equivalent compound annual rate before taking the median.
| End month | Sets | 25th percentile | Median total change | Median annualized change (CAGR) | 75th percentile | No positive change |
|---|---|---|---|---|---|---|
| Dec 2016 | 815 | −4.2% | +7.4% | +7.4% | +25.0% | 34.8% |
| Dec 2018 | 815 | +3.9% | +29.2% | +8.9% | +69.7% | 21.5% |
| Dec 2020 | 815 | +15.8% | +52.6% | +8.8% | +104.3% | 16.0% |
| Dec 2022 | 815 | +23.3% | +75.4% | +8.4% | +148.0% | 13.9% |
| Dec 2025 | 815 | +23.0% | +80.2% | +6.1% | +165.9% | 15.0% |
By the ten-year endpoint, the middle half of the panel ranged from +23.0% to +165.9%, and 15.0% had no positive change. Even within this historically observable group, the outcomes were far from uniform.
The annualized figure does not mean values rose by 6.1% in each individual year. Nor is it a net return from buying and selling these sets. It is calculated separately for each set from its unrounded endpoint ratio; we do not annualize the rounded median shown in the table.
Keeping the sets fixed removes changing membership within this comparison, but does not remove selection bias. A set must have enough recorded values in later years to enter the panel at all. Historically well-covered sets can differ from poorly covered or missing sets. This is a long-run panel of observable sets, not a randomly selected collection that an investor could necessarily have bought at the baseline estimates.
How sensitive are the findings to data coverage?
Ten recorded days is our main eligibility rule. We also reran the analysis with twenty days in each endpoint month, requiring all eleven Decembers to qualify for the stricter fixed panel. This check has an important gap: no sets qualify for the 2024 or 2025 annual comparisons, and no fixed panel remains at twenty days.
The reason is visible in the recorded coverage. In December 2024, no individual set has more than 18 recorded days with valid positive values. The month therefore cannot support a twenty-day requirement. This affects both adjacent annual comparisons and the full fixed panel. We did not establish the cause of that recording pattern and have not filled the missing days.
| Comparison | Sets: 10 days | Median: 10 days | Sets: 20 days | Median: 20 days |
|---|---|---|---|---|
| 2020 | 2,428 | +14.3% | 2,324 | +14.4% |
| 2022 | 4,372 | +12.3% | 2,591 | +11.5% |
| 2025 | 5,829 | +1.2% | 0 | – |
| Aug 2025 → Aug 2026 | 5,837 | +1.7% | 5,569 | +1.7% |
“–” means no estimate can be calculated, not zero growth. The 2025 and long-run findings remain results under the ten-day rule; the stricter check does not confirm them. The same limitation applies to 2024 even though that row is not repeated in this compact sensitivity table. Earlier annual comparisons remain estimable at twenty days, but their set counts can change substantially.
The latest rolling year is still estimable with the stricter rule: 5,569 sets qualify and the median remains +1.7%. That agreement is useful for this particular comparison, not proof that the whole dataset is free from coverage or estimation bias.
What does this mean for valuing your own sets?
The study provides historical context, not a sale-price prediction. The difference between a sealed set’s estimated value and the amount you receive depends on its condition, where and how you sell, and whether a buyer is available. Used or incomplete sets are outside this study’s value definition.
Start with the particular set rather than applying the annual median to your entire collection. Our Lego value checker is the more appropriate starting point for an individual set’s current estimate. Check the condition and price history, then allow for the costs and uncertainty of a real sale.
An attractive purchase discount can change your personal outcome; so can selling fees, taxes, shipping, storage, damage and the time needed to find a buyer. None of these is included in the percentages above. The values are also nominal euros, with no inflation adjustment. A value increase is not automatically an equivalent increase in purchasing power or a realised profit.
The practical takeaway is therefore narrower than “Lego always goes up”: recent sampled estimates rose modestly, many sets did not rise, and longer-term changes vary widely. These historical results are not a promise of future gains or a recommendation to buy particular sets.
Methodology, source and limitations
Source and coverage. We used Brickfact’s recorded EUR estimated sealed-set values and catalogue identities. Across the published ten-day comparisons, 7,667 distinct sets contribute 1,455,936 recorded set-days across 55,389 set-months. These totals deduplicate endpoint months reused in more than one comparison. They are not daily coverage of every set throughout the entire period.
Input filtering. The selected endpoint months contain 1,601,806 source rows. We exclude 4,089 null prices and one otherwise-valid price without a catalogue match. No nonfinite or nonpositive prices occurred in this extraction. The remaining 1,597,716 valid input rows collapse to 1,597,121 recorded set-days; the smaller used-coverage total above counts only the months and sets entering published comparisons.
Monthly estimates. Multiple valid values for the same set on the same UTC day are averaged first, so a duplicated day does not receive extra monthly weight. We then take the median of the daily values in each calendar month. Eligibility counts distinct recorded days, not rows. We introduce no interpolation, carry-forward, substitution for missing months or use of partial months.
Set-level changes. Each eligible set’s target-month estimate is divided by its baseline-month estimate, minus one. We calculate continuous percentiles across these set-level changes and round only the final percentages to one decimal. All finite positive input values and all resulting gains and losses remain; we do not discard unusually strong or weak outcomes to make the series smoother.
Annualization and panel selection. For the fixed panel, each set’s unrounded value ratio is raised to twelve divided by the number of elapsed months, minus one. The reported CAGR is the median of those individual annualized rates. Every December from 2015 to 2025 must qualify, including years not separately displayed in the long-run table. The twenty-day check recomputes eligibility rather than retaining the ten-day membership.
What a recorded day means. The source series contains operational market-value estimates, not verified sales. Upstream producers can transform, filter or smooth their inputs, and historical methods can change. A recorded day is therefore not proof of a new independent marketplace quote. Avoiding interpolation in this analysis does not undo transformations that already occurred upstream.
Limits. Current catalogue membership and historical coverage determine what can be observed. Neither the annual samples nor the fixed panel is representative of every Lego set, and fixed-panel membership depends on future data availability. Monthly endpoints do not reveal the path taken within the year. The study does not identify causes, measure realised investment returns, compare themes, or account for costs, liquidity and inflation. We did not use Brickfact user accounts, portfolios, personal transactions or authentication data.
The cutoff is exclusive: observations must be dated before 6 September 2026 at 00:00 UTC. The charts and tables are a fixed research snapshot, not a live feed. Historical records may later be corrected; those corrections do not silently replace the published findings. Further studies are collected in Lego Research & Investment.